Parametric Curves
by Venessa Brown
The goal of this assignment is to investigate a pair of functions in a plane:
x = f(t)
y = g(t)
I chose to exlore,
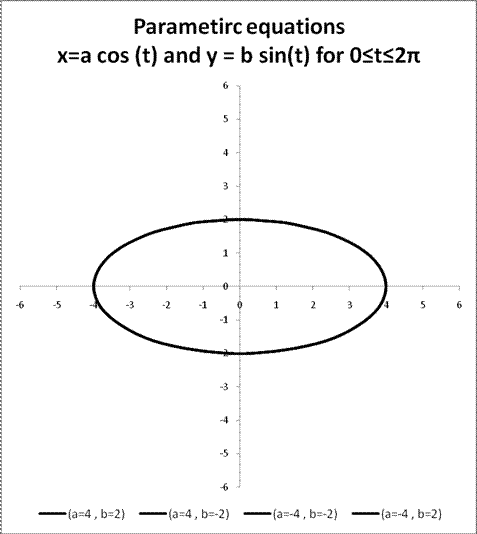
For various a and b, investigate x = a cos(t) ; y = b sin(t) for 0≤t≤2π.
Notes on cosine and sine functions
Both the cosine and sine functions move sinuously from t=0 to t=2π, with cosine starting 1 and sine starting at 0 when t= 0 and both ending at their starting point of 1 and 0 respectively when t=2π. For both functions, the crest (highest point) is 1 and the trough (lowest point) is -1.
Specific to the equations of x = a cos(t) and y = b sin(t) for 0≤ t ≤2π, we can note the following:
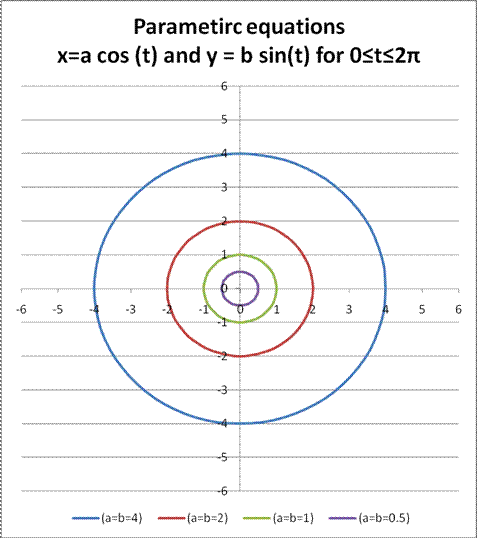
- a and b are scalars that adjust the amplitude (magnitude of the crest and trough) but otherwise has no impact on the cycle (or period) of the function.
- these cosine and sine functions move sinuously from t=0 to t=2π, with cosine starting at a and sine starting at 0 when t= 0 and both ending at their starting point of a and 0 respectively when t=2π. For the cosine function, the crest (highest point) is a and the trough (lowest point) is -a, while for the sine function, the crest (highest point) is b and the trough (lowest point) is -b.
Signs of a and b
Considering t=0 as the starting point and t=2π as the ending point, we can note the following in the Cartesian plane:
So, when a and b are positive, the function will start at (a,0) and then move (counter-clockwise) in order through quadrants I, II, III, & IV. When a is positive and b is negative, the function will start at (a,0) and then move in order (clockwise) through quadrants IV, III, II, & I. When a and b are negative, the function will start at (-a,0) and then move (counter-clockwise) in order through quadrants III, IV, I, & II. When a is negative and b is positive, the function will start at (-a,0) and then move in order (clockwise) through quadrants II, I, IV, & III.
However, it is important to note that due to the sinuously values for cosine and sine, the equations x = a cos(t) and y = b sin(t) for 0≤ t ≤2π will go through exactly the same points for any given values of a and b, irrespective of the sign of a or b.
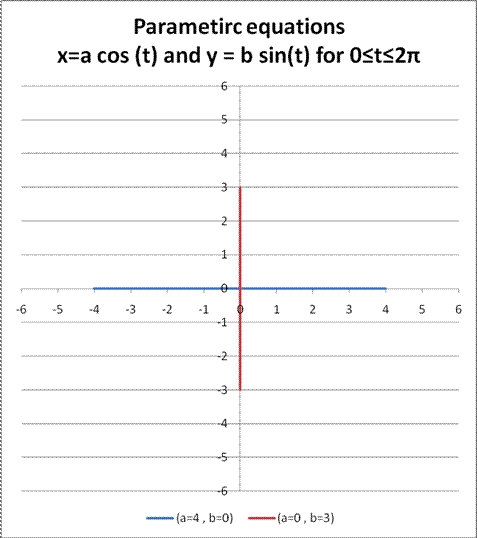
E.g. See the graph below has the overlapping values of the parametric equations x = a cos(t) and y = b sin(t) for 0≤ t ≤2π when:
Observation
Relating x and y
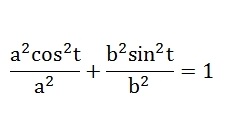
From trigonometric properties, we know that
cos²t + sin²t = 1
So,
Now, since
x = a cos(t) and y = b sin(t) for 0≤t≤2π
then for -1≤ x ≤1 and -1≤ y ≤1
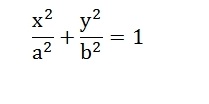
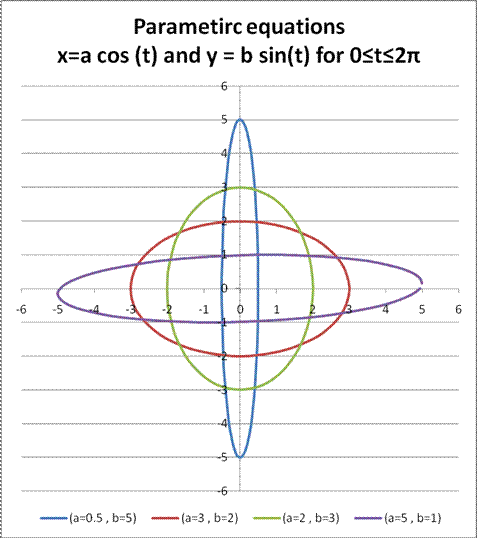
This was displayed in the graphs, this is an equation for an ellipse around the origin (x=0,y=0).
The vertices are (-a,0) and (a,0) along the x-axis and (0,-b) and (0,b) along the y-axis.